
Energy and Fertiliser Costs
- Monday April 3, 2006
This analysis featured in the April 3, 2006 issue of the HGCA's MI Prospects, Volume 8, Number 19
Key points
- Crude oil, diesel and petroleum derivative prices still a third above last year
- US maize and soyabean production costs a third higher than last year
- US maize/soyabean area ratio has fallen from 1.25:1 ten years ago to1.1:1
- Prairie sown field pea area expected at 1.4M ha this year and exports at over 2Mt
- UK nitrogenous fertiliser prices have risen by more than 50% over the last five years
With dramatic increases in energy and fertiliser costs over the last two years, farmers across the globe are looking at ways to economise. In most situations their options are limited. The major exception to this is the opportunity for US farmers to sow more soyabeans and less maize.
Farm input prices are generally stable when compared with output market prices and, therefore, not often an issue for farmers when making production decisions. Over the last two years, however, price increases in crude oil, and to a lesser degree in natural gas have had a material impact on the cost of production and particularly on farm fuel and fertiliser (Graph 1, 2). Legumes, with their ability to more than meet their own nutrient nitrogen needs, have thus enhanced production cost advantages over other crops.
continue continued
continue
continued
continue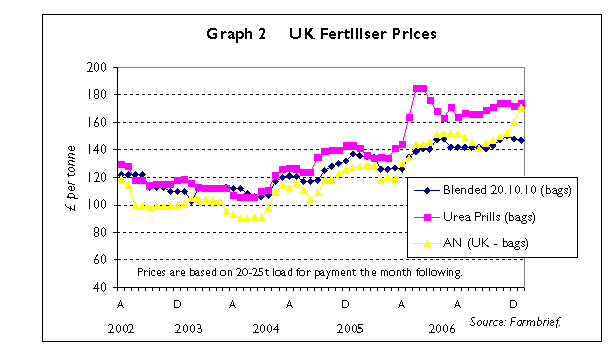 continued
It is also evident that farms are often distant both from consumption centres for their output and the source of their farm inputs. Although competition rather than costs usually determine the prices farmer receive and pay, farmers are likely to end up bearing the higher transportation costs. UK farmers, due to their closeness to major population centres, undoubtedly have an advantage over their counterparts isolated on the US Great Plains and Canadian Prairies.
US
The US Department of Agriculture (USDA) forecasts that US farmers will spend US$13.8, US$12.6 and US$3.5 billion this year, respectively on fertiliser, fuel and oil, and electricity (Table 1). Together they account for nearly 80% of farm expenditures on manufactured inputs and pose an increase of almost 50% on five years ago. Fuel expenditures have doubled, fertiliser expenditures have increased by about 40%, while electricity expenditures have remained relatively flat.
continue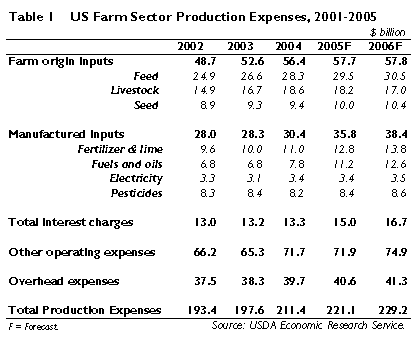 continued
Prices for natural gas, a major component of nitrogenous fertilisers, ballooned to over US$11 / MBtu in autumn but have since slipped back to about US$7, a level not much higher than a year ago. Although crude oil prices declined from their peaks in early autumn and diesel and petroleum derivative prices have fallen also, they remain still about a third above last year’s level.
But for US agriculture as whole fuel, fertiliser and electricity only account for about 13% of total input expenditures. For crop production, however, they represent a much higher percentage, depending on the crop. USDA projections made last November suggest that farmers can typically expect to spend about US$250 and US$60 / ha on fertiliser, fuel, oil and electricity for the production of maize and soyabeans (Table 2). These represent 24 and 8% of total forecast maize and soyabean production costs. While both these figures are about a third higher than last year, the cost increase is naturally much larger for maize than for soyabeans and it is not reflected in returns for the two crops.
continue continued
As in many instances Corn Belt farmers have the option of growing either of these spring sown crops, production of less expensive soyabeans will clearly appear more attractive. Most farmers may be restricted to some degree by agronomic and management considerations. Also such factors as soil moisture conditions, sowing progress, market prospects, concerns over soyabean rust, and indeed prices for these inputs when purchases are actually made will influence decisions.
These factors may have a greater or smaller impact in any particular year. But the ratio of maize to soyabean area, which was typically 1.25:1 until ten years ago and has subsequently fallen to around 1.1:1, is likely to continue to fall if current energy costs are sustained.
Another crop likely to benefit from higher fuel and fertiliser costs is Western Canadian field peas. Originally seen as a niche market commodity mainly for human consumption, field peas have grown to a level where they compete as a protein source in conventional feed markets. A Prairie sown area of 1.4M ha and exports of over 2Mt are anticipated this year. With fertiliser costs 25% of those for cereals and 15% of those for canola, it is seen as a viable option by an increasing number of farmers. Interest in legumes/pulses is likely to be evident around the world while current energy costs continue.
UK
UK farmers are faced with the same challenge as their US counterparts (Graph 2, above). While farm input prices have tended to be more stable than crop output prices, even with the stabilising influence of the EU CAP, the energy related farm inputs have risen significantly in recent years.
UK nitrogenous fertiliser prices have risen by more than 50% over the last five years and those of blends by about half that amount. While other issues have had an impact, higher energy costs and natural gas prices are the underlying cause of the increases. Fuel prices have doubled over the last five years with the reductions in the rebate on farm fuels contributing to increases.
In the UK, and probably generally in Europe, soyabeans and other pulse crops are not regarded by many farmers as a major production alternative, even if they are relatively inexpensive to grow. There was no evidence of any significant switch to pulse crops this autumn or is there likely to be in the spring. In England, for instance, an estimated 75,000 ha were sown to winter beans this autumn, down 6.8% from last year, compared to 1.65M ha sown to winter wheat, down 4.2% from last year.
The reduction in the area of winter wheat, despite generally favourable sowing conditions, was generally attributed to increased fallowing of less favourable land with the advent of single farm payments.
David Walker 001 780 434 7615David Walker 001 780 434 7615
top of page