
US Prospective Plantings and Supply
- Tuesday April 14, 2010
This analysis featured in the April 14, 2010 issue of the HGCA's MI Prospects, Volume 12, Issue 20
Key Points
The USDA 2010 prospective planting report confirmed the continuation of a long established trend in US crop areas, namely increases for maize and soyabeans and decreases for wheat. The implications for 2010/11 export availability of US grain is less certain. But assuming trend yields, export availability of maize and soyabeans may increase while that of wheat should decline slightly.
The USDA Prospective Planting Survey report provides the first reliable indication of 2010 spring planting. With this and average yields, prospective supplies can be projected, though with a somewhat lower level of reliability. This article uses USDA projections for US domestic needs to gauge export supply prospects for the next season.
Maize and soyabean plantings 2010
The 2010 USDA Prospective Plantings survey which was undertaken in early March and published on March 31, indicates further expansion in both maize and soyabean area at the expense of most other crops. Planned planting to all major crops at 103.5Mha is 1% lower than last year's actual planting, but almost 1% above last year's prospective area (Table 1).
continue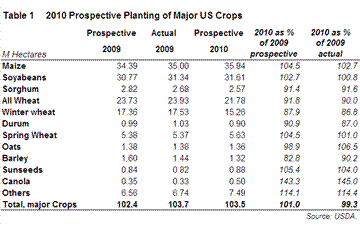
The maize area was surveyed at 35.9M ha, 3% above last year and the soyabean area at a record of 31.6M ha, 1% above last year. Also, the combined area of maize and soyabeans, at 67% of the total area planted to major crops would be a record. A late soyabean harvest in the autumn prevented sowing of Soft Red Winter wheat which provided additional area for maize and soyabeans. However, improved prospects for cotton has seen a partial recovery in the cotton area. The growth of maize and soyabean area relative to almost all other crops is a continuing trend (Graph 1).
continue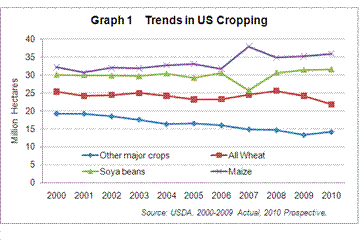
The surveyed areas for maize and soyabeans were quite close to trade estimates just prior to the release of the report. The maize area was also close to the projected area from the USDA in late February. The soyabean area however, is almost 0.5M ha larger than seen in February.
Prospects for new crop soyabeans as reflected in futures market prices have held up better than those for most other crops. Declining fertiliser prices over the winter months appear to have offset prospects for lower maize prices in the new crop year. Maize and soyabean price trends, market prospects and field conditions during the April-May sowing season have in the past been seen as causing adjustments to decisions made in early March. In recent years, however, actual sown areas have been close to the March prospective planting indications, particularly where only minor change from prior year areas had been indicated.
Once a decision has been made with the very significant farm input commitments that result from it, farmers may be reluctant to go back on initial decisions at short notice. There is increasing evidence that farmers will sow later by choice, knowing they have the capacity to get their crops in a very short space of time.
Maize and soyabean export availability
While the USDA February Outlook Forum projections for maize area and hence production still appear accurate, projections for domestic maize consumption needed revision in the light of USDA's March 1 grain stocks report. March 1 stock figures were about 5.1Mt above trade expectations, indicating lower than previously anticipated domestic consumption. The USDA confirmed this by lowering feed usage projections by 2.5Mt in April. The implication of carrying these adjustments forward to 2010/11 would be an18% or 15Mt higher export availability than last season at approximately 102Mt (Table 2).
continue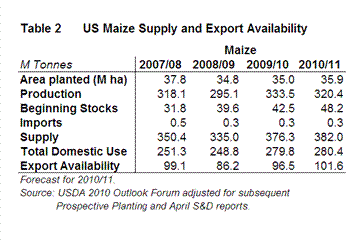
For soyabeans, a larger prospective area combined with trend yields suggest an output of 90Mt, 1.5% below this year's record yielding crop. Reduced domestic usage indicated from March 1 stocks report and confirmed by the USDA's April Supply and Demand revisions, is projected to add 0.7Mt to next year's supplies. Total export availability for the coming year is now projected at 46.2Mt, almost 20% (8.5Mt) above the low supply of 2008/09 (Table 3). This combined with anticipations for record crops from South America suggests that international oilseed markets will be well supplied in 2010/11.
continue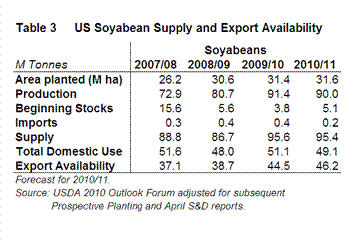
Wheat plantings 2010
Total prospective wheat area was estimated at 21.8Mha, down 9% from 2009. Of this, the winter wheat area is seen at 15.3Mha, 13% below last year but 2% above the USDA's estimate published in January. The Hard Red Winter wheat area grown mainly in the Great Plains totalled about 11.5Mha, down about 11% from last year. Soft Red Winter wheat was estimated at 2.4Mha, down 28%. The White wheat area was surveyed at 1.4Mha. The 2010 prospective area planted to other spring wheat was estimated at 5.6Mha, up 1% from 2009. The durum wheat area was seen at 0.9Mha down 13% on 2009/10.
Poor market prospects have been a significant driver for the lower wheat area, although difficult sowing conditions last autumn were an additional deterrent for farmers. The wheat area is the lowest since the 1970's. There is little doubt that the border between areas considered too dry for maize and soyabeans and only suitable for more drought tolerant wheat has moved to the west in recent years. Evidence of this is the expectation that maize and soyabean area this year will exceed that of wheat in the State of Kansas, emblematic of the later crop.
Prospective wheat export availability
Assuming trend yields, the 2010 US wheat crop is expected at 52.9Mt, 12% smaller than the 2009 crop. However, a larger carry-over will result in supplies slightly above those of 2009/10 (Table 4). March 1 stocks data indicated some increase in domestic consumption which was confirmed in the USDA's April Supply and Demand revisions which also raised export projections. These two revisions reduced ending stock projections by 1.4Mt but remain 8Mt above the previous season's stock level. When carried forward to 2010/11, export availability is seen at 48.1Mt, some 6% above 2008/09, but 3% below 2009/10. While some tightening of US supplies would be evident, this is likely to little significance in the context of abundant European wheat supplies.
continue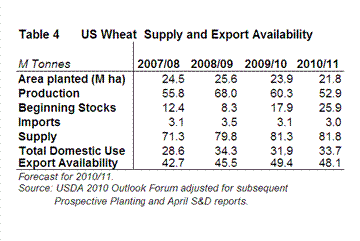
David Walker (001) 780 434 7615
top of page